I built this lab to practice onboarding Windows, Linux, and firewall telemetry into a single Splunk Enterprise instance. The configurations and screenshots below show the setup and searches I used. Where I did not retain a version or measurement, I leave it unspecified.
1. Lab scope and architecture
I used a single Linux-hosted Splunk Enterprise instance on a Dell PowerEdge R720. It combined receiving, indexing, and search roles. For this published example, I replaced the backend address with 192.0.2.10, a documentation-only address; replace it with your receiver address when reproducing the lab. I did not record the Splunk, forwarder, or add-on versions.
Two Windows sources were onboarded: a workstation and an Active Directory domain controller. Both used the same Universal Forwarder inputs for Application, Security, System, and Sysmon. This baseline collects operating-system telemetry from the domain controller; it is not a complete Active Directory monitoring configuration.
Windows Event Logs + Sysmon → Universal Forwarder
                           → TCP 9997 → single-node Splunk Enterprise
My transport was non-TLS TCP. The Windows and Sysmon add-ons were installed on the combined backend. Sysmon was already installed on both endpoints; its installation commands, configuration policy, and event filtering were not recorded.
2. Prepare the receiver and destination index
I enabled the receiving input in /opt/splunk/etc/system/local/inputs.conf:
[splunktcp://9997]
disabled = 0
The destination was defined in /opt/splunk/etc/system/local/indexes.conf:
[wineventlog]
coldPath = $SPLUNK_DB/wineventlog/colddb
homePath = $SPLUNK_DB/wineventlog/db
thawedPath = $SPLUNK_DB/wineventlog/thaweddb
These are the paths I used. Merge stanzas into existing files rather than replacing unrelated settings. A managed deployment can package the same configuration in a dedicated app. Restart the backend using its configured service mechanism after checking configuration; ensure the host/network firewall permits TCP 9997 from the forwarders.
3. Configure both Windows forwarders
On each endpoint, the recorded C:\Program Files\SplunkUniversalForwarder\etc\system\local\outputs.conf selected the single receiver:
[tcpout]
defaultGroup = default-autolb-group

[tcpout:default-autolb-group]
server = 192.0.2.10:9997
The group name is a label: with one configured server, this lab did not provide receiver redundancy. The following input configuration was applied to both machines in the corresponding inputs.conf:
[WinEventLog://Application]
disabled = 0
index = wineventlog

[WinEventLog://Security]
disabled = 0
index = wineventlog

[WinEventLog://System]
disabled = 0
index = wineventlog

[WinEventLog://Microsoft-Windows-Sysmon/Operational]
disabled = 0
index = wineventlog
renderXml = 1
sourcetype = XmlWinEventLog
The lowercase XmlWinEventLog value is preserved from this lab, the sourcetype I used in this lab. Verify the effective sourcetype and installed add-on mappings before reusing it. renderXml = 1 changes the event representation; successful extraction of fields such as Image and CommandLine still needs a search-level check.
4. Validate configuration and source coverage
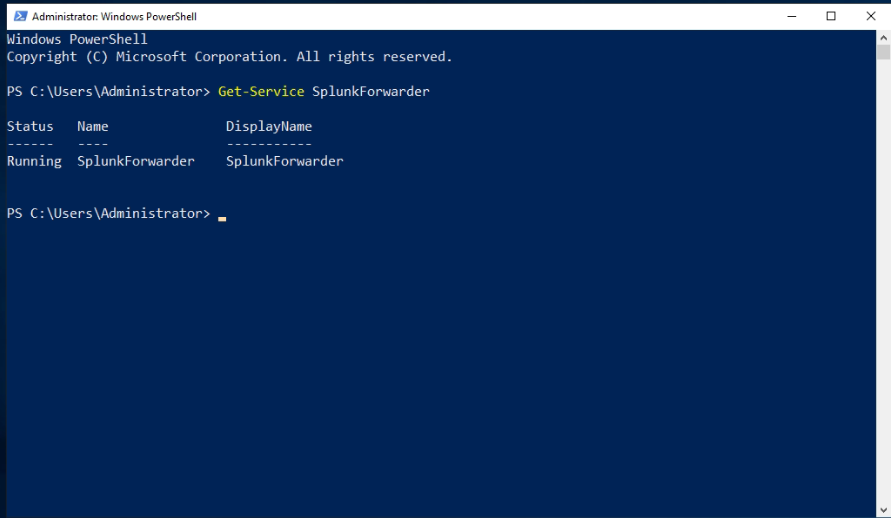
I configured restarting the Windows SplunkForwarder service. I used the following elevated PowerShell checks to review the merged configuration and receiver connection:
$Splunk = 'C:\Program Files\SplunkUniversalForwarder\bin\splunk.exe'
& $Splunk btool inputs list --debug
& $Splunk btool outputs list --debug
Get-Service SplunkForwarder
Test-NetConnection 192.0.2.10 -Port 9997
# After reviewing and applying the intended configuration:
Restart-Service SplunkForwarder
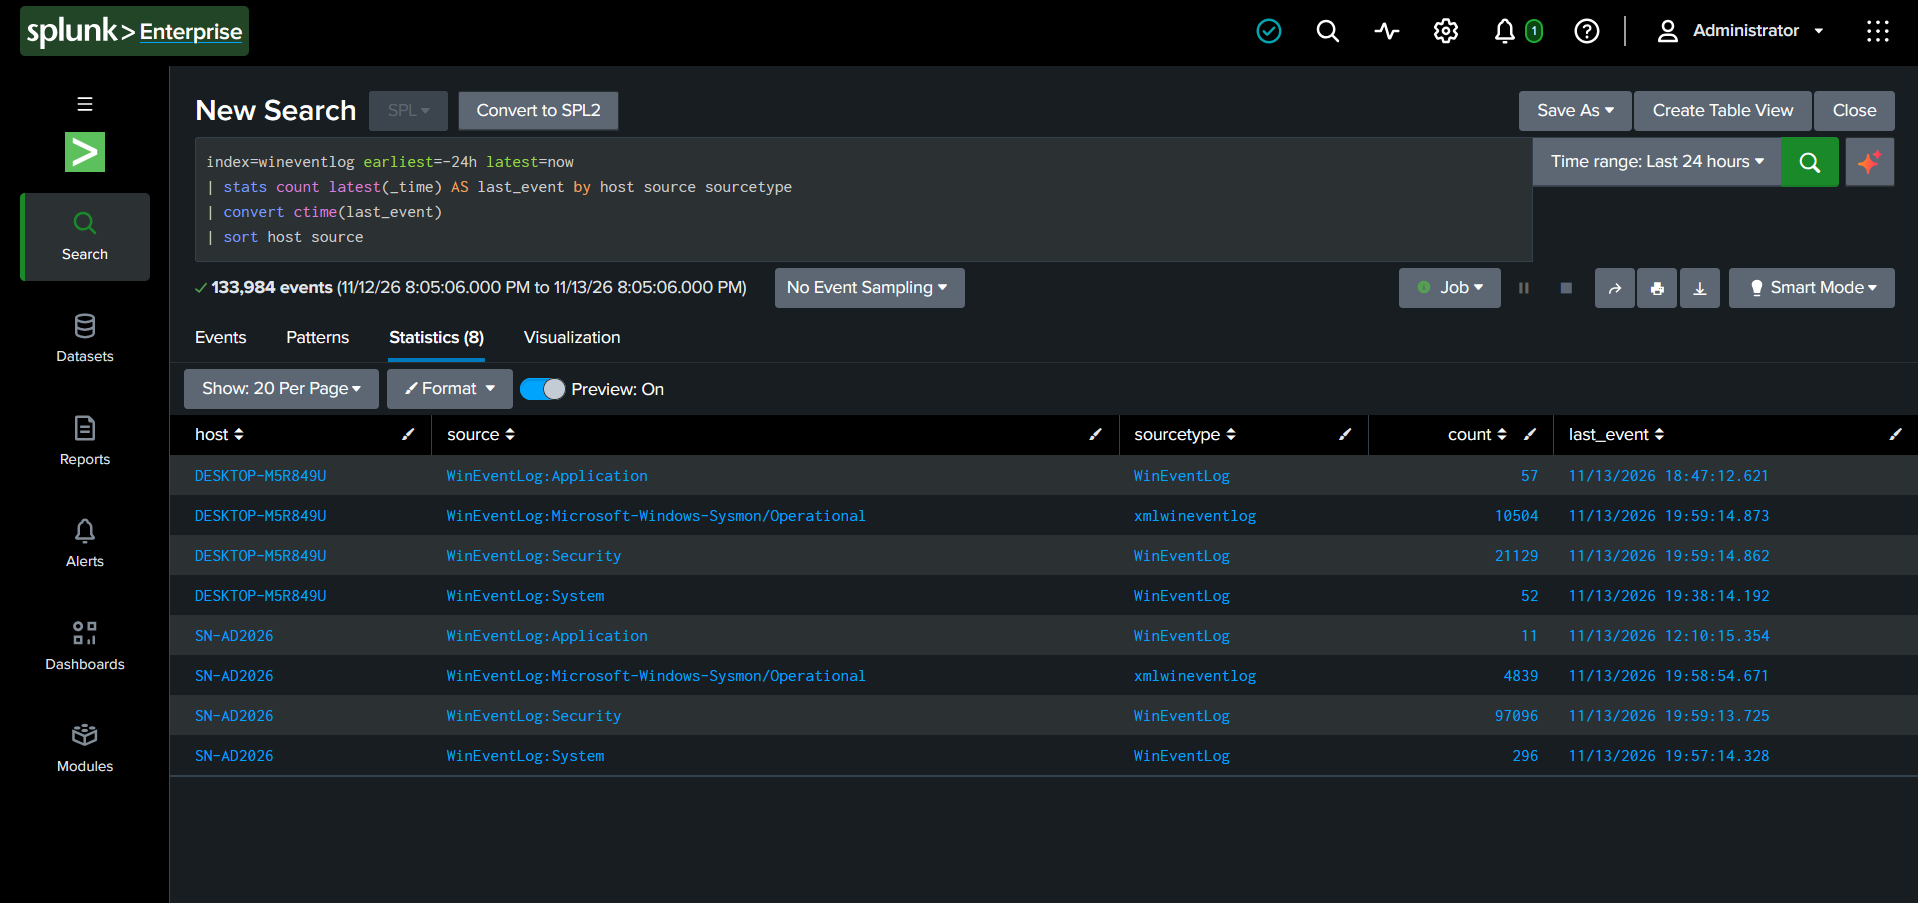
Run the inventory search below and compare the observed hosts with the expected workstation and domain controller. Inspect channel coverage on each host rather than treating an aggregate count as proof that both are complete.
index=wineventlog earliest=-24h latest=now
| stats count latest(_time) AS last_event by host source sourcetype
| convert ctime(last_event)
My sysmon_data macro expands to index=wineventlog sourcetype=XmlWinEventLog. This equivalent query avoids depending on the macro when validating another environment:
index=wineventlog sourcetype=XmlWinEventLog earliest=-24h latest=now
| table _time host source sourcetype EventCode Image CommandLine _raw
| head 20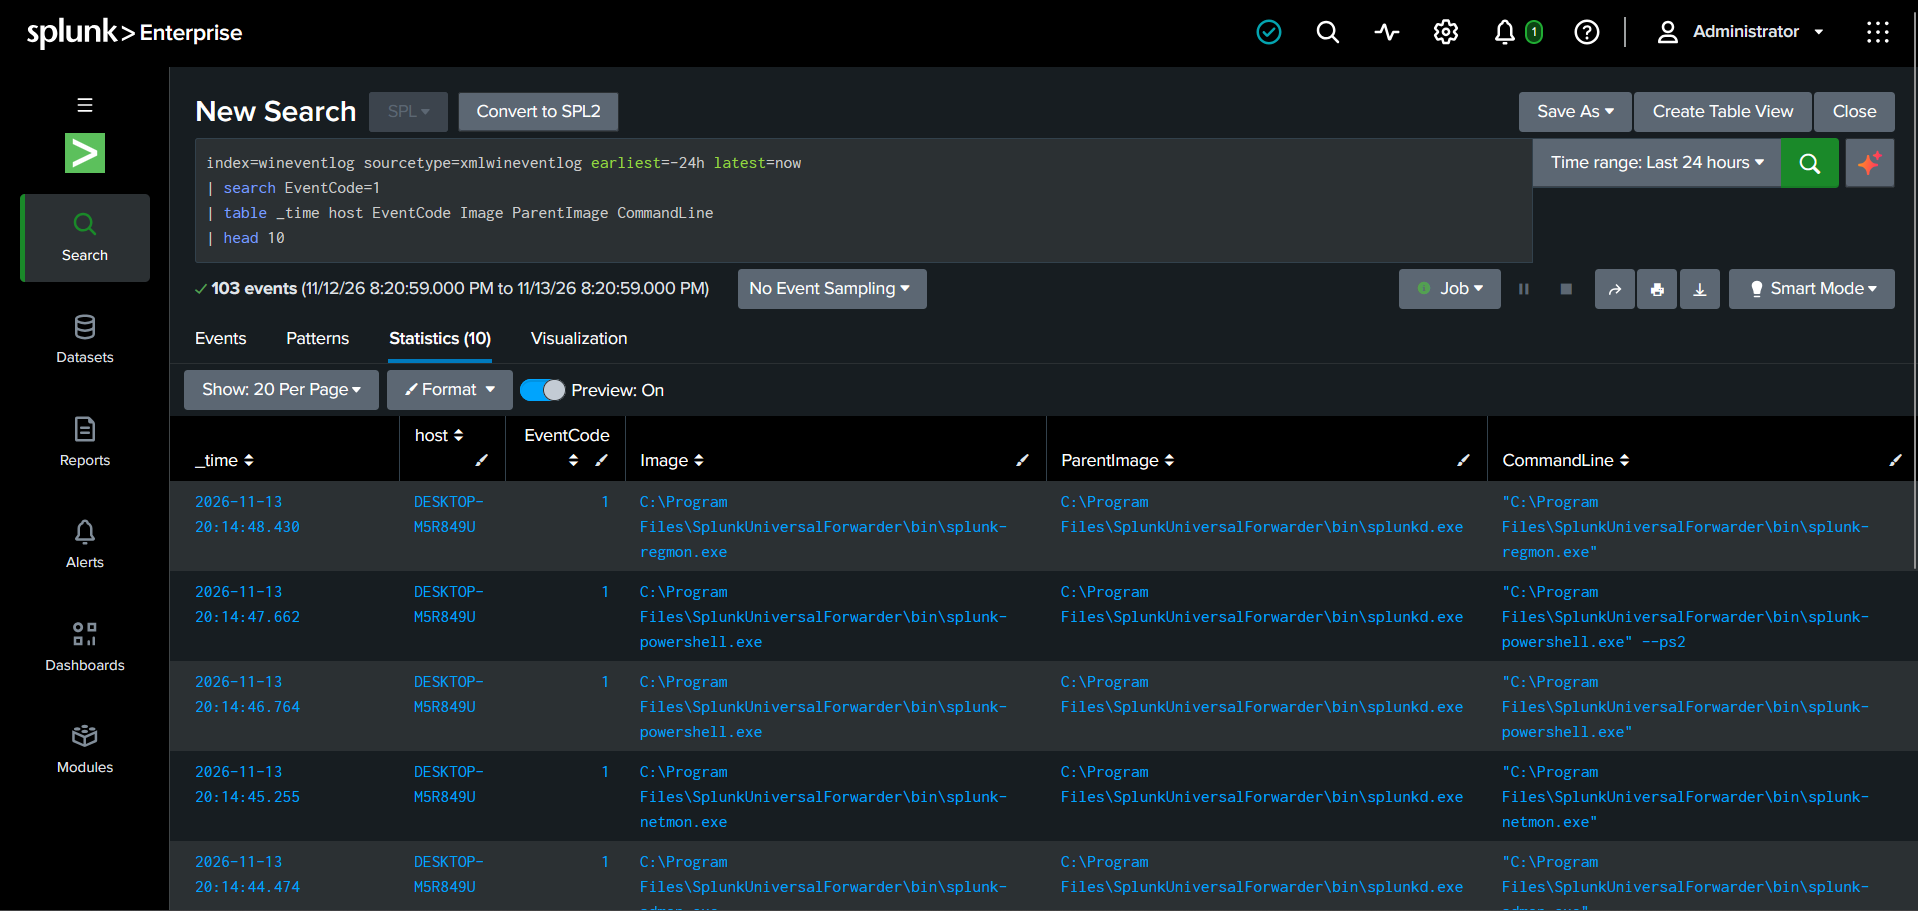
Some fields apply only to particular Sysmon event types. If process fields are missing, inspect the raw XML, event ID, add-on configuration, and actual source type before changing regexes. Check timestamps against the source record and timezone; search-time field extraction does not establish correct index-time timestamp recognition.
5. Domain controller coverage and recorded outcome
I confirmed both Windows machines onboarded. No distinct AD input set, Directory Service channel, DNS Server collection, advanced audit policy, or Sysmon policy was supplied. Security events depend on the effective Windows audit policy; installing a forwarder cannot create missing source events.
I did not document a Windows-specific failure during this onboarding. For a fuller audit-domain deployment, I would add and validate Directory Service and DNS Server channels and document the effective audit policy. Those sources were outside the baseline configuration I completed here.
6. Diagnose missing Windows data
| Observation | Next check |
|---|---|
| Forwarder running, no events | Effective inputs/outputs, receiver access, index existence, local channel contents, and forwarder diagnostics. |
| Only one machine appears | Distinct host identity, service state, configuration, and connectivity on each endpoint. |
| Sysmon events present, expected fields absent | Raw XML, event type, effective sourcetype, add-on mappings, and search context. |
| AD activity missing | Relevant channels and audit policy, followed by a known authorized event. |
7. References and next steps
- Splunk — Windows event log collection
- Splunk — forwarding configuration
- Splunk — inspecting merged configuration
The documentation links support the configuration explanation; they do not establish the unrecorded software versions used in this lab. Continue with Kali Linux onboarding and FortiGate syslog onboarding.
Onboarding new sources or troubleshooting Splunk ingestion?
Contact me to discuss Splunk data onboarding, source validation, and SIEM engineering.