I built this lab to practice onboarding Windows, Linux, and firewall telemetry into a single Splunk Enterprise instance. The configurations and screenshots below show the setup and searches I used. Where I did not retain a version or measurement, I leave it unspecified.
1. Lab architecture and collection choice
I used a single Linux-hosted Splunk Enterprise instance on a Dell PowerEdge R720. It combined receiving, indexing, and search roles. For this published example, I replaced the backend address with 192.0.2.10, a documentation-only address; replace it with your receiver address when reproducing the lab. I did not record the Splunk, forwarder, or add-on versions.
FortiGate → UDP 5514 → Splunk network input → index=network
          → sourcetype=fgt_log → asset_inventory lookup
I used direct UDP ingestion, without rsyslog, syslog-ng, or SC4S. Port 5514 avoided the privileged-port binding requirement associated with port 514. It did not add authentication, encryption, buffering, or delivery guarantees.
I installed the Fortinet add-on on the combined backend; I did not record its exact package name or version. I assigned fgt_log in this lab; inspect the installed add-on before assuming that value activates the correct parsing or CIM mappings in another deployment.
2. Configure the Splunk input and index
My /opt/splunk/etc/system/local/inputs.conf contained:
[udp://5514]
connection_host = ip
sourcetype = fgt_log
index = network
The backend’s indexes.conf defined:
[network]
coldPath = $SPLUNK_DB/network/colddb
homePath = $SPLUNK_DB/network/db
thawedPath = $SPLUNK_DB/network/thaweddb
The lab restarted Splunk after these changes. Merge into existing configuration, verify the destination index, and restrict the UDP input to expected firewall senders using network/host controls. connection_host = ip derives host identity from the observed sender address, which may be a translated or relay address.
sudo /opt/splunk/bin/splunk btool inputs list --debug
sudo /opt/splunk/bin/splunk btool indexes list --debug
sudo ss -lunp | grep ":5514"
3. Configure FortiGate forwarding
I configured the following destination settings, with only the receiver address substituted for publication:
config log syslogd setting
    set status enable
    set server "192.0.2.10"
    set port 5514
    set facility local7
    set format default
end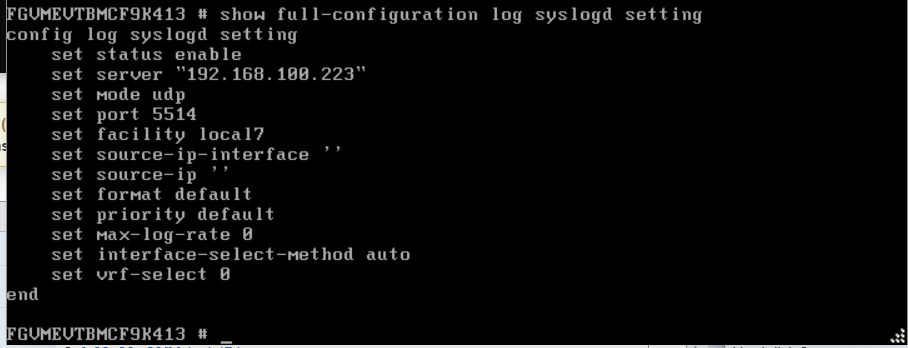
My architecture identifies UDP, but the saved command block does not explicitly set transport mode. Verify the effective configuration on the appliance. On releases exposing the option, set mode udp makes the intended transport explicit; it is version-dependent, so I verify it against the FortiOS release before applying it.
I enabled forward and local traffic filters. The saved command block includes set traffic enable, but the FortiOS version and accepted command output are absent. Do not treat that line as portable syntax. For FortiOS releases that support these options, I use this reference pattern:
config log syslogd filter
    set forward-traffic enable
    set local-traffic enable
end

show full-configuration log syslogd setting
show full-configuration log syslogd filter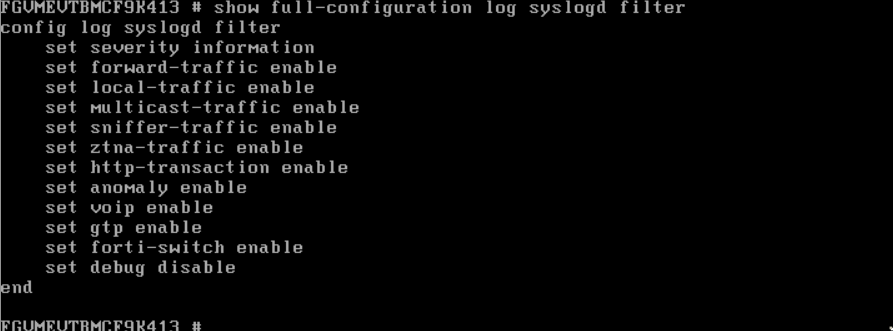
Inspect CLI help and the applicable FortiOS reference before changing filters. Confirm the correct VDOM and existing logging destinations. Relevant firewall policies must generate traffic records; enabling forwarding alone does not enable every policy or security-profile log. Policy-level settings, severity filters, VDOM/HA details, and categories beyond basic traffic were not recorded.
4. Verify transport, events, and extracted fields
To check network arrival separately from Splunk indexing, I capture a small sample on the receiver while generating an authorized firewall event:
sudo tcpdump -ni any -c 10 -s 0 -A 'udp dst port 5514'Search the recorded destination and inspect the actual host/source metadata:
index=network sourcetype=fgt_log earliest=-24h latest=now
| stats count latest(_time) AS last_event by host source sourcetype
| convert ctime(last_event)
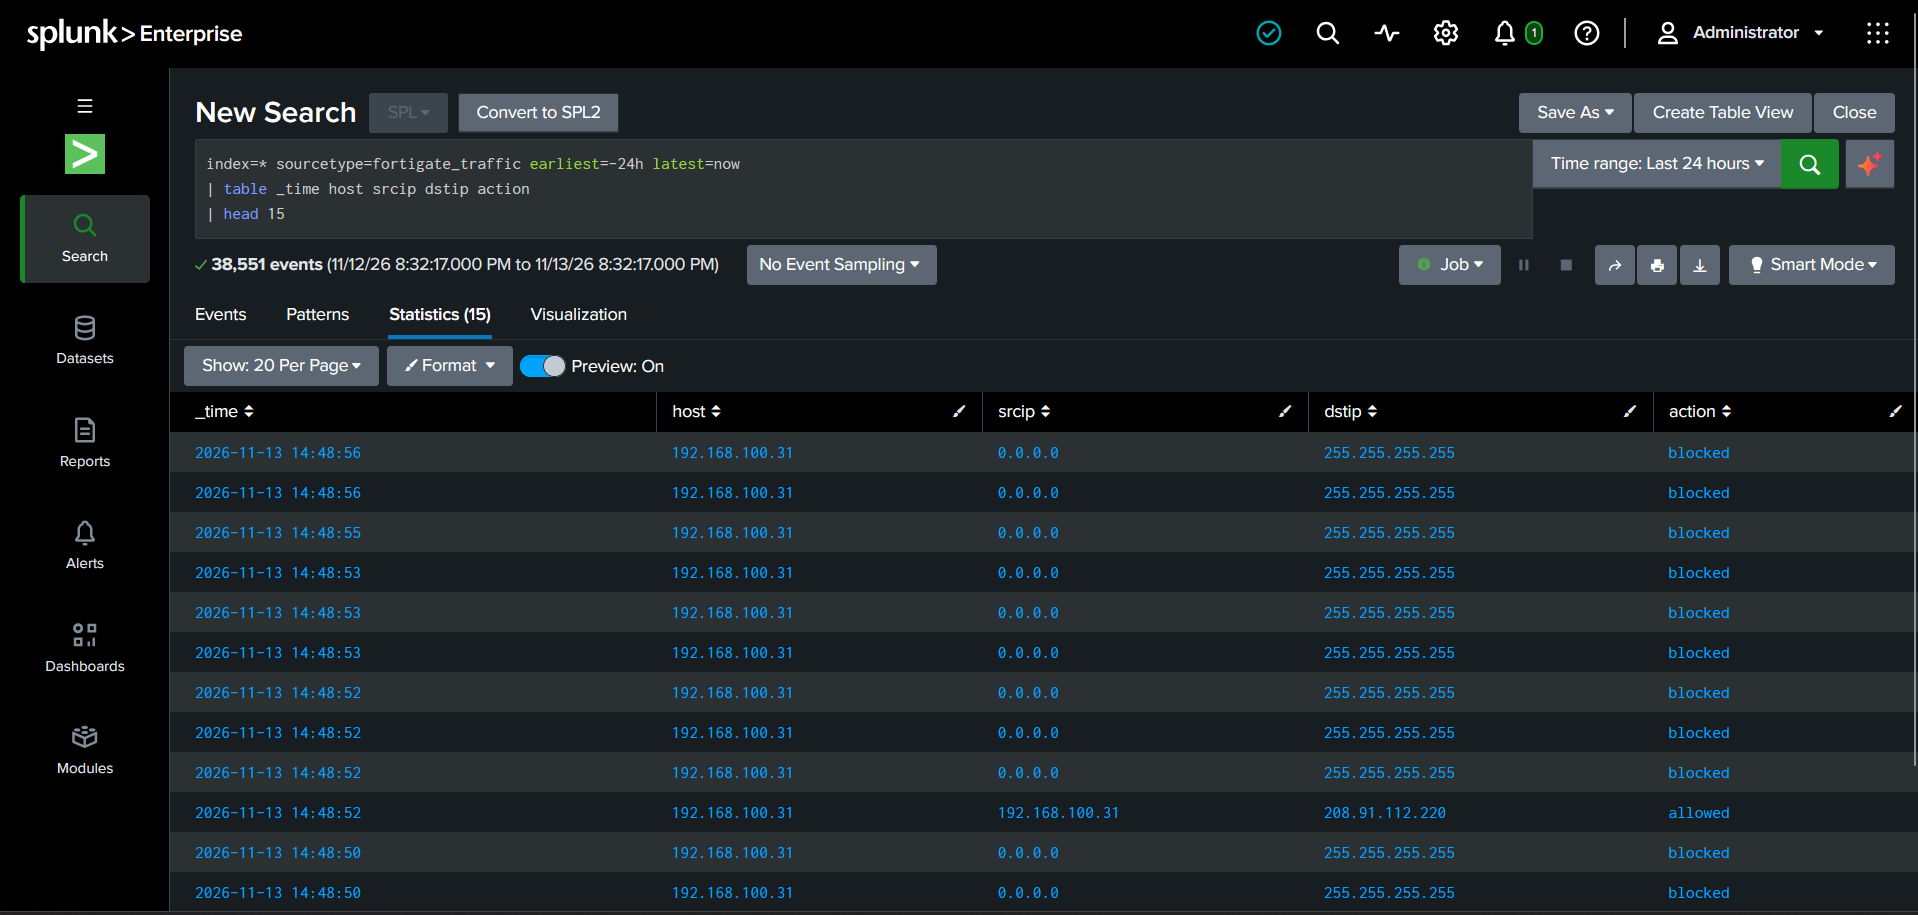
index=network sourcetype=fgt_log earliest=-24h latest=now
| table _time host source sourcetype srcip dstip action _raw
| head 20Compare each extracted value with its raw key-value record. A named sourcetype or installed add-on is not evidence that extraction succeeded. When fields are absent, inspect the effective parsing and search-time configuration:
sudo /opt/splunk/bin/splunk btool props list fgt_log --debug
sudo /opt/splunk/bin/splunk btool transforms list --debug
If the first query returns nothing, widen to index=network and inspect actual source types before changing inputs. Verify event timezone and indexed time independently; my lab notes’s general description of automatic timestamp handling does not establish that every FortiGate timestamp was validated.
5. Enrich source addresses with asset context
I defined asset_inventory using lab_assets.csv. My search matched the lookup’s ip column to the event’s srcip field:
index=network sourcetype=fgt_log
| lookup asset_inventory ip AS srcip OUTPUT asset_role, priority
I confirmed successful enrichment but contains no lookup rows or returned events. The lookup definition must exist, be visible to the search, and expose the expected column names. Match source identity deliberately: NAT addresses, missing srcip, and stale inventory can all affect the result.
For a repeatable review, this additional search preserves any existing context fields and makes unmatched rows visible:
index=network sourcetype=fgt_log earliest=-24h latest=now
| lookup asset_inventory ip AS srcip OUTPUTNEW asset_role priority
| eval asset_match=if(isnotnull(asset_role), "matched", "unmatched")
| table _time host srcip dstip action asset_role priority asset_match
| head 50
OUTPUT can overwrite fields; OUTPUTNEW preserves existing values. Neither option proves the lookup’s business context is accurate. Compare a known inventory entry and an address intentionally absent from the inventory before relying on enrichment in detections.
6. Reliability and troubleshooting
Direct UDP was the recorded lab implementation. Splunk recommends a dedicated syslog collection layer for syslog ingestion. UDP can lose records during receiver downtime or load; a TCP port change alone does not establish TLS or durable buffering. A future collector design needs its own transport, queue, retention, and restart validation.
| Observation | Next check |
|---|---|
| No UDP packets | Destination, route, transport, FortiGate log generation, and filters. |
| Packets present, no searchable events | Listener ownership, enabled input, index existence, splunkd diagnostics, and time range. |
| Events present, missing fields | Raw format, actual sourcetype, installed add-on, and props/transforms configuration. |
| Lookup fields missing | Extracted srcip, lookup visibility, CSV columns, and matching inventory entry. |
7. Outcome, limits, and references
I confirmed FortiGate onboarding and asset lookup enrichment. No detailed FortiGate troubleshooting sequence, raw sample, event counts, or coverage proof for IPS, VPN, antivirus, or administrative events was supplied. Those capabilities are therefore not claimed as validated outcomes.
- Splunk — TCP/UDP inputs and syslog collection guidance
- Splunk — lookup command
- Splunk — effective configuration inspection
- Fortinet — version-specific syslog destination settings
- Fortinet — log settings and targets
Related articles: Windows and AD onboarding and Kali Linux onboarding.
Onboarding new sources or troubleshooting Splunk ingestion?
Contact me to discuss Splunk data onboarding, source validation, and SIEM engineering.